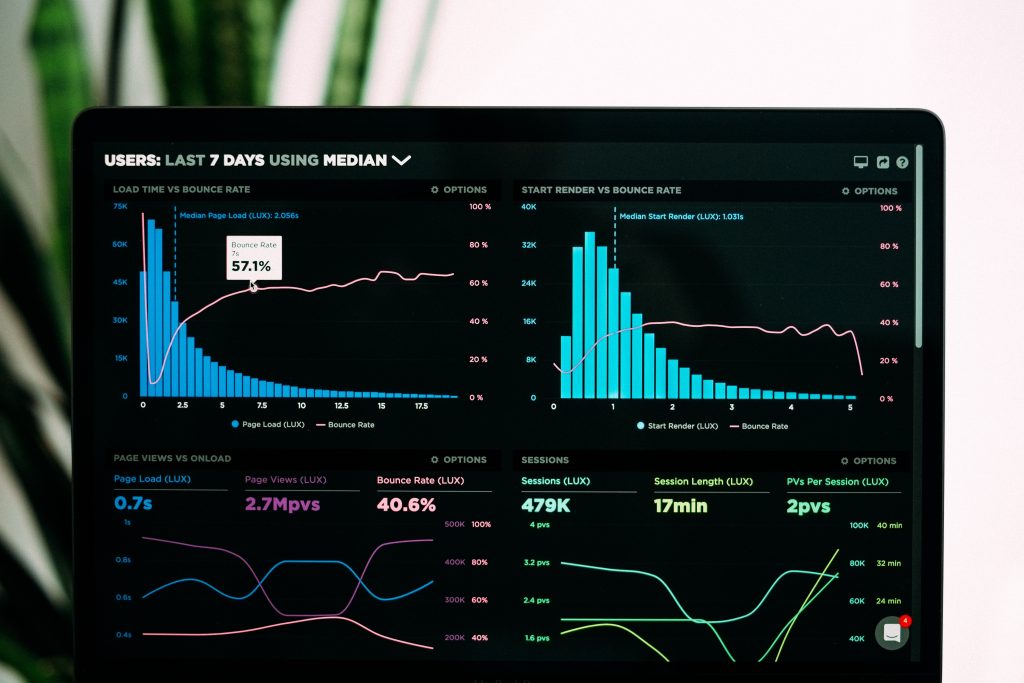
Analytical Dashboards

The Future of Business Intelligence: Analytics Dashboards

The prebuilt dashboards in Service Analytics are designed with best practices to enable you to derive value from your TROOLOGY data quickly. With these dashboards, you can efficiently handle service cases, predict and comprehend essential business performance indicators, and visualize trends. Additionally, the dashboards facilitate prompt responses to your inquiries about your service business’s outcomes.?

TROOLOGY

Analytical Dashboards

A dashboard designed for analytics is a versatile tool that facilitates the organization, visualization, analysis, and tracking of data. Its primary objective is to simplify the understanding of data and enable data analysts, decision-makers, and ordinary users to gain deeper insights and make more informed data-driven decisions.

Dashboards are specifically created to extract and connect important information from various data sources, services, and APIs, and present it in a consolidated view using visuals such as graphs, charts, tables, and figures. Organizations can customize dashboards for each department or project to facilitate granular monitoring of specific KPIs.

Modern data analytics dashboard software incorporates AI and machine learning to automate time-consuming processes such as data collection, discovery, preparation, replication, and reporting. This automation is particularly essential for large datasets where manual processing is not practical. Additionally, interactive dashboards employ attractive designs and real-time dynamic data visualization to provide compelling storytelling, empowering teams to reveal hidden insights and draw valuable conclusions that can inform business decisions and answer critical business questions.

<

What is an analytical dashboard?

The form and content of dashboards vary depending on the business need they aim to fulfill, their intended audience, and their purpose. As a result, dashboards can be categorized based on their function. In this context, we are discussing the analytical dashboard.

Dashboards are crucial tools for developing a company’s business intelligence strategies. An effective dashboard presents the appropriate data to the relevant individuals, thereby enhancing communication and decision-making processes.

Types of Analytical Dashboards

Operational

Operational analytics dashboards have a primary focus on tracking the advancement of work and displaying the present state of operations. These dashboards are designed to provide real-time insights, primarily to identify any potential issues. However, they are generally not employed for conducting in-depth data analysis.

Strategic

The primary purpose of strategic analytics dashboards is to present Key Performance Indicators (KPIs) and easily understandable data visualizations in a concise and easily digestible format. The main focus is to provide users with immediate insights into the trends and progress of their KPIs, allowing them to monitor and comprehend whether their KPIs are progressing as planned.

Analytical

An analytical dashboard prioritizes flexibility and enables users to examine data from various perspectives using filters, comparisons, and other techniques to uncover hidden insights. These dashboards frequently incorporate drill-downs, predictive models, and what-if scenarios.

Analytics Dashboard Benefits

Various types of data analytics dashboards offer numerous benefits, including improved data visibility and accessibility, the ability to measure performance, facilitate business forecasting, and enable agile responses.

Visibility and accessibility:

A dashboard offers one of the most significant advantages in presenting crucial data in a format that is intuitive, comprehensible, and beneficial for the average user. Its primary purpose is to provide users with a consolidated space to access key metrics and insights, allowing anyone within the organization to derive value from it.

Measuring and performance:

Dashboards can be useful tools to monitor and track the performance of various teams, departments, products, and services. In order to evaluate the overall performance of an organization, it is essential to establish key performance indicators (KPIs) and gain access to targeted performance data. This enables the identification of inefficiencies in processes and facilitates the development of new strategies.

Agility:

Dashboards facilitate rapid detection of data changes, empowering users to take swift action. By providing real-time updates, users can promptly adjust their course of action or proactively respond to upcoming trends.

Forecasting:

AI and machine learning algorithms utilize both historical data and real-time data to detect patterns and outliers and predict potential issues before they escalate into major problems. By forecasting, these technologies can assist in guiding demand planning, financial operations, future production, risk mitigation, and digital marketing operations.

Exploratory

A methodology that utilizes diverse techniques to enhance comprehension of a dataset, reveal hidden patterns, extract crucial variables, identify outliers and irregularities, and assess underlying assumptions.

Descriptive

What is happening currently, based on incoming data? Typically, a real-time dashboard and/or email reports.

Diagnostic

What is currently occurring based on incoming data? Normally, this is reflected in a real-time dashboard and/or email reports.

Predictive

An analysis of this nature exposes the appropriate course of action, and it is deemed the most valuable form of analysis, typically leading to the formulation of guidelines and recommendations for subsequent actions.

The advantage of using an Analytics Dashboard

An analytics dashboard serves as the control panel for your business, providing you with a comprehensive overview of your company’s performance, either in general or in detail. This powerful tool helps organizations quickly and easily identify workplace statistics based on Key Performance Indicators (KPIs). By enabling users to visualize and review data at a glance, dashboards enhance the overall efficiency of business analytics. Similarly, web analytics dashboards help businesses quantify and take action on information related to their online presence. In today’s data-driven business environment, visually-oriented big-data solutions are essential, especially since 41% of organizations report their current systems cannot effectively make sense of large volumes of data from various sources. Together, these analytics processes can significantly impact a company’s success.

Frequently Asked Questions

An analytics dashboard is a visual representation of data that allows users to quickly and easily understand key metrics and trends. Dashboards are typically interactive, allowing users to drill down into the data to gain a deeper understanding of the information.

The benefits of using analytics dashboards include the ability to quickly and easily understand key metrics and trends, make data-driven decisions, identify areas for improvement, and monitor progress. They also allow users to drill down into the data to gain a deeper understanding of the information.

Examples of the types of data that can be displayed on an analytics dashboard include financial data, marketing data, sales data, customer data, and operational data. Dashboards can also be used to display data from a wide range of sources, such as web analytics, social media, and transactional data.

Analytics dashboards can be used in a wide range of industries, such as finance, marketing, operations, and customer service. They can be used to track performance, monitor progress, identify areas for improvement, and make data-driven decisions.

The challenges of using analytics dashboards include the need for quality data, the complexity of the data, and the need for specialized expertise. There are also concerns about security, data privacy, and compatibility with other systems. Additionally, it may require a significant investment in terms of time and resources to create, implement and maintain the dashboards.